Did you know… About the CHSPACE command?

The CHSPACE (Change Space) command is simply a lifesaver for anyone using paper space to put together your project drawings.

In AutoCAD, CHSPACE can be typed in at the command line or found in the Modify menu or ribbon panel. In Carlson with IntelliCAD, CHSPACE can be typed in or easily accessed from the right-click context menu after the items have been selected.

This command will move entities from model space to paper space or vice versa. You must be working in model space through paper space in order to move entities from model to paper – it will not work directly from model space. The nice thing about the command is that it will scale the entities (to account for the differences in scale between model and paper space) so you don’t have to. The AutoCAD version of this command actually performs a MOVE command on the entity whereas the IntelliCAD version gives you the option of moving the original or making a copy to the other space. If you’re using AutoCAD, make a copy of the entity before performing the CHSPACE command.

I find this command most handy when I have a linear project such as a water line or force main extension project with many sheets of plan and profile that change direction. In model space, I make multiple copies of the North arrow and place them along the meandering alignment. Then, from paper space, I make each viewport active and use CHSPACE to move one of the copies to the paper space sheet.


Software Review: AutoCAD and IntelliCAD

The May 2012 issue of Professional Surveyor magazine has been published. This month they are featuring a software review I submitted: AutoCAD and IntelliCAD.

You can order your FREE subscription to the print version of Professional Surveyor here.

You can click here to learn more about Carlson Software‘s offerings that include IntelliCAD.


That CAD Girl – April 2012 Newsletter

In case you missed it, here is our April 2012 Newsletter


Thank you to the Richmond AutoCAD Manifest (RAM)

I’d like to thank Art Thomas and the Richmond Virginia AutoCAD User Group for inviting Jeremy and me to demonstrate Carlson Software and data collection last night. Our hour-and-a-half long presentation covered the basic tools and Survey, Civil and GIS specific features of the Carlson products.

The RAM User Group has been active for 20+ years and has a lot to offer CAD users in the central Virginia area. Their meetings are usually on the 3rd Wednesday of each month and start after work at 5:30. If you’re based in the Richmond area, I’d highly recommend that you join up with them.


Did you know… About Coordinate Display Toggles?

Did you know that, when you’re in AutoCAD or IntelliCAD, you have a couple of different options when it comes to displaying the coordinate position of your crosshairs?

For instance, when you’re NOT in a command, you have two options for displaying the coordinate position of your crosshairs as it moves across your screen: On or Off. If the coordinate display is toggled ON, then the X, Y and Z position (rectangular coordinates) of your crosshairs are displayed and if it’s OFF, then the X, Y and Z display is frozen and doesn’t update as your mouse moves.

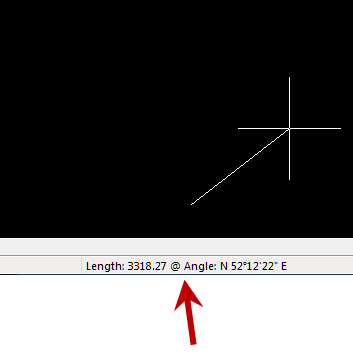
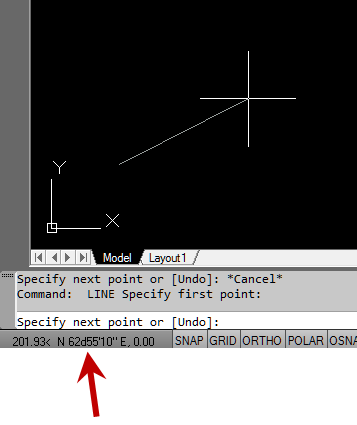
However, if you are currently in a command that requires two points be picked to specify an angle and distance (commands such as Line or Move, etc), you have a 3rd coordinate display available to you: polar coordinates. Unlike rectangular coordinates that display X, Y and Z position, polar coordinates report a distance and angle from the original point. For instance, when you start the Line command you can toggle the coordinate display so that rectangular coordinates are ON or OFF. But, after picking the first point of the line, you can toggle the coordinate display so that rectangular coordinates are ON, rectangular coordinates are OFF or that polar coordinates are ON.

The image below on the left shows the polar coordinate display in AutoCAD and the IntelliCAD version is shown below on the right:

IntelllliCAD Coordinate DisplayAutoCAD Coordinate Display


To toggle the coordinate display in newer versions of AutoCAD (since 2009?) double-click on the coordinate display. In older versions of AutoCAD and in IntelliCAD, the F6 button toggles the display.


Did you know… How easy it is to spruce up your dimensions?

Anyone who has worked with AutoCAD for any length of time can usually create a standard dimension object. However, if you pay close attention to two items in the Object Properties dialog box, you can get very creative with the way simple dimensions are displayed.

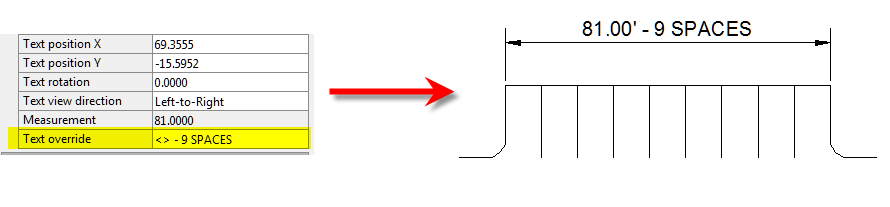
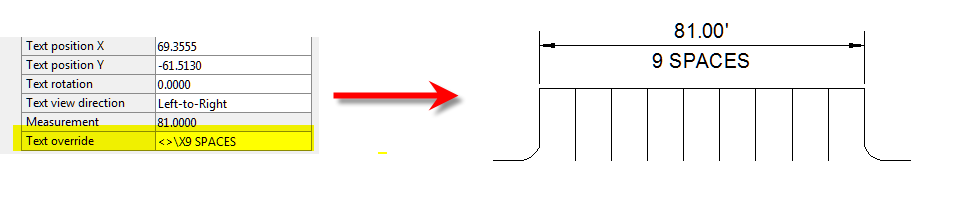
For instance, in the image just below, you can see that there are two Object Properties items highlighted in yellow. One is the “Measurement” and the other is the “Text override”. The Measurement is the measured distance between the dimension definition points (DEFPOINTS) and is read-only. You can also see that the current value for Text override is “< >”. Whenever the less-than and greater-than signs are shown as the Text override value, the Measurement will be substituted for the symbols when displayed in the drawing.

Dimension Example

To add just a little more detail to the dimension, you can add descriptive text before or after the “< >” in Text override as shown in the next example below. As long as you keep the “< >”, the correct measured distance will always be displayed as part of the dimension text:

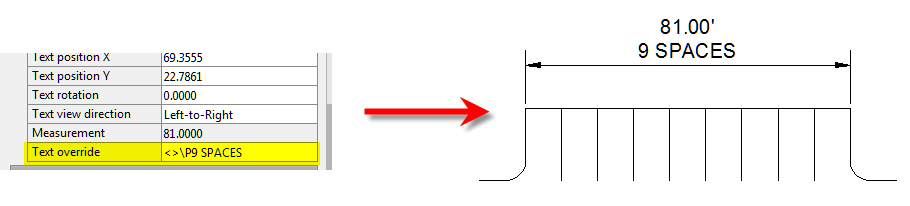
Dimension Example 2And, making it fancier… In the example below, I have added a “P” between < > and “9 SPACES”. This is like pressing Enter to go to a second line and has the effect of stacking two lines of text above the dimension line:

Dimension Example 3

And, finally, one more option. Rather than entering “P”, if you enter “X” as part of your Text override, you will stack the text partially above and partially below the dimension line.

Dimension Example 4The “P” and “X” modifiers can also be used in combination to create 3 or more lines of text and allowing you to control how many lines appear above and how many appear below the dimension line.


Did you know… About Temporary Overrides?

There are others, but my two favorites are:

  • Holding Shift while in a Draw or Modify command allows you to override your current ORTHO setting.

So, if you’re drawing a line and ORTHO is Off, holding Shift will temporarily turn ORTHO On. As soon as you let up on the Shift key, ORTHO will be Off again. Likewise, if ORTHO is On, holding Shift will temporarily turn it Off.

  • Holding Shift while in the Fillet command allows you to override your current Radius setting and apply a Radius of 0.0 between the two selected entities.

So, if you’re drawing a parking lot and find yourself constantly changing your Fillet Radius between 0.0 and another value to create both sharp and rounded corners, leave the Radius set to something other than 0.0 and just hold Shift when you pick the two entities to apply a 0.0 Radius.


These Temporary Overrides are available in all “flavors” of AutoCAD as well as in IntelliCAD.


Did you know… About the “Mid Between 2 Points” OSnap?

It hasn’t been around forever, but this Object Snap is such a handy little tool you’ll wonder how you ever managed to live without it! The best news is that it’s available both in AutoCAD and IntelliCAD.

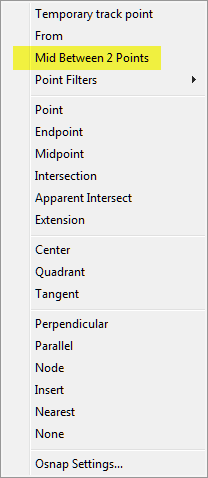
Whenever you’re prompted to “Specify a point:”, you can enter “M2P” at the Command: line or you can hold your shift key + right-mouse to display the pop up box and select “Mid Between 2 points” option. This allows you to snap to the MidPoint between two other points. The pop up box is shown below.

Mid Between 2 Points


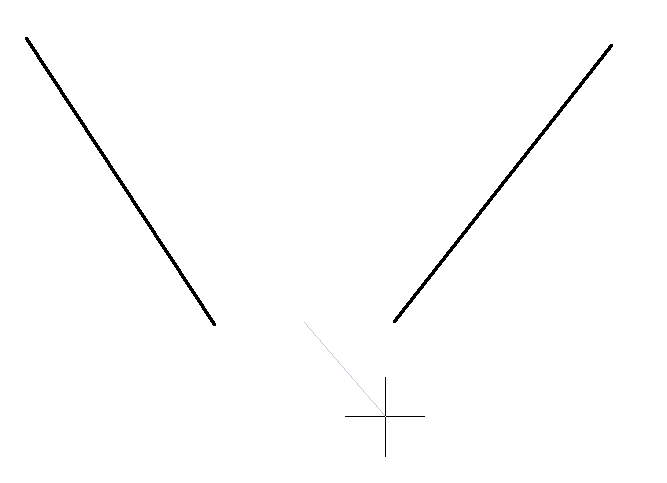
Next you’ll be prompted to specify two new points for which you can use additional OSnap settings. The example below shows a new line that starts at the Midpoint between the ENDpoints of the two existing lines.Finding the MidPoint Between Two ENDpoints


Did you know… About the Upright flag for linetypes?

I didn’t until this weekend.

While working on a new Picks and Clicks article for Professional Surveyor magazine I stumbled on something incredibly handy. This setting keeps text that’s inserted into a linetype in an Upright position rather than allowing it to be upside-down. 

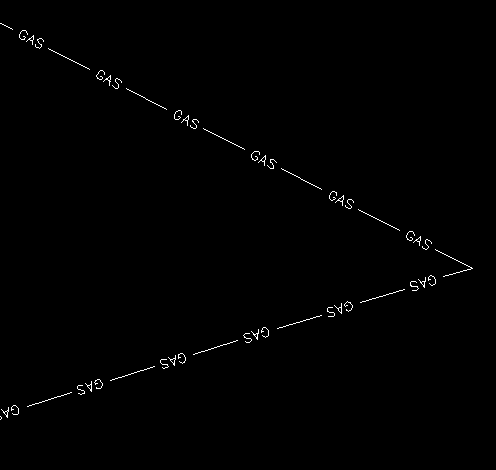
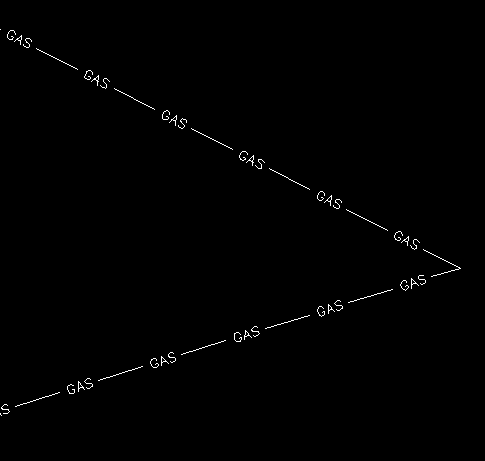
Notice the polyline in the picture below. The top segment (drawn from left to right) has the text upright but the bottom segment (drawn from right to left) shows the text upside-down.


text is upside-down in linetype

The reason this happens is because of the definition of the “GAS_LINE” linetype in the acad.lin file.

The R=0.0 parameter formats the linetype text so that it aligns with the line segment. Therefore, whether text is upright or upside-down depends on the direction the line is drawn. However, if you simply change the R=0.0 to U=0.0, the polyline displays like this:


text is upright in the linetype

Notice the text is now upright in both segments. Using the U in the linetype definition sets the “Upright” flag. Setting it to 0.0 keeps it Upright relative to the line. I played around with it a bit and, unfortunately, it doesn’t seem to help much when rotating with DVIEW or UCS. But, when you’re working in world coordinates, this is a great tool.

To my knowledge this is a recently added enhancement to AutoCAD – but I thought it was cool enough to put up here!

My next column in Professional Surveyor will be… Surprise! Standardizing Linetypes! I’ll post a link here when it’s posted on their site. Follow this link to see if you are eligible for a free subscription to the print magazine: Subscribe to Professional Surveyor magazine.


Picks and Clicks: The Key to Standardizing Annotation in CAD Files

This article originally appeared in the June 2011  issue of Professional Surveyor magazine.

Part 1

The issue of CAD standards has long been one of my pet projects when working with clients. It’s the universal problem, as folks from every office confess that CAD standardization is either “non-existent” or, at least, “could be better.”

In my experience, the single most-intimidating aspect to developing a CAD standard is deciding how to standardize annotation in order to accommodate the multiple scale factors used in a typical plan set. Other types of sheets surveyors and civil engineers may have to produce are:

  • a cover sheet (at 1:1 or no scale),
  • one or more project or phase site plan sheet (at 1:50, 1:100, 1:500, 1:1000, etc.),
  • plan and profile sheets (at 1:30, 1:50, etc.), and
  • detail sheets (at 1:1 or no scale).

It’s not an easy issue to resolve, and CAD programs seem to vary from bad to worse in their ability to manage multiple scales within a single CAD file.

Some of the information provided here is very basic, but in my experience even long-time CAD users struggle a bit with the “under-the-hood” details about annotation sizing. So, that being said, where should you start?

Determine the Plotted Size, Plotted Height, Plotted Distance … of Everything

The most important first step when developing a CAD standard for annotation is to determine the desired plotted size of annotation entities. And, when we discuss annotation, we must remember that this encompasses more than just text; it also means linetype patterns and dimension styles.

Here are several sample questions to ask when developing a CAD standard for annotation:

  • When plotted, what is the height (in inches) of the text displaying:

– the project title in the title block?

– the road name?

– contour labels?

– 
property line bearings and distances?

  • When plotted, how far off the property line (in inches) should the bearing and distance label be placed?
  • When plotted, what is the distance (in inches) between labels along a contour?
  • When plotted, what is the length (in inches) of the arrowheads at the end of dimension objects?
  • When plotted, what is the distance (in inches) that the extension line extends beyond the dimension line?
  • When plotted, what is the length (in inches) of the dashes and gaps in the linetype used to show existing contours?

Overwhelmed yet? Don’t be. Once you commit to the size or height of a few entities, the rest come fairly easily just because you know that you want one entity a little smaller or a little bigger than another.

The remainder of this column covers the issue of standardizing text sizes in your CAD files. Future columns will cover the other questions relating to linetypes and dimension styles in much more detail.

Standardizing Text Sizes and Placement
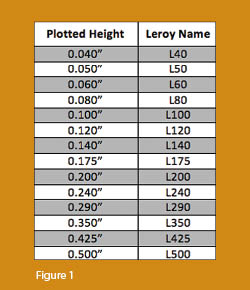
Although text height can be set to any desired value, the most commonly used height for plotted text in civil/survey drawings is 0.08”. There are several other standard text styles (corresponding to the height of the plotted text), known as “Leroy,” that have been adopted from the days of hand and technical lettering. Even though the “Leroy” text style usually has a Simplex font, the naming convention is widely accepted to describe text of a specific height regardless of its font.  For instance, L80 text refers to a Leroy style text that plots 0.08” high; L100 is Leroy with a plot height of 0.10”; and L200 is Leroy with a plot height of 0.20”. Other standard heights and style names are shown in figure 1.

L80, or text that plots 0.08” high, is generally used for basic text such as bearings and distances, contour labels, and notes. For more prominent text such as road names or parcel numbers an L150, or text plotting 0.15”, may be used.

You may be saying, “Yeah, that’s great and all, but when I enter text it asks me for the height of the text to be placed in the drawing, not its plotted height.” If you use the generic commands for placing text, that is true. However, most civil/survey programs have specialized commands for labeling that also take into account a horizontal scale that you specify independently for each drawing.

For instance, in Carlson Software or Civil 3D, you can specify program defaults so that bearing and distance labels always have a plotted height of 0.08”. Then, as each new drawing is started, you set its horizontal scale. For a drawing with a horizontal scale set to 1”=50’, the bearing and distance labels will be placed in the drawing at a height of 4.0’ (0.08 x 50 = 4.0). For a drawing with a horizontal scale set to 1”=100’, the bearing and distance labels will be placed in the drawing at a height of 8.0’ (0.08 x 100 = 8.0). The plotted height never changes.

Consider what a written standard for annotation would look like if we did not base the standard on the plotted size but on the actual drawing size of text…

  • In all 50-scale drawings, bearing and distance labels shall be placed in the drawing at 4.0’ high.
  • In all 100-scale drawings, bearing and distance labels shall be placed in the drawing 8.0’ high.
  • In all 50-scale drawings, all property corner labels shall be placed in the drawing 3.0’ high.
  • In all 100-scale drawings, all property corner labels shall be placed in the drawing 6.0’ high.
  • Unless otherwise specified, all other text in a 50-scale drawing shall be placed in the drawing 4.0’ high.
  • Unless otherwise specified, all other text in a 100-scale drawing shall be placed in the drawing 8.0’ high.

Now, with the understanding that all annotation sizes must be scaled by the horizontal scale, we can simply say:

  • All road names shall be L150.
  • All property corner labels shall be L60.
  • Unless otherwise specified, all other text shall be L80.

As you can see, because the text sizes refer to a plotted height, it makes the writing of CAD standards for annotation remarkably easier.
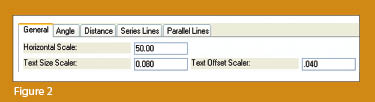
It is also important to note that, when placing text in a drawing, parameters other than text height can be adjusted to get the desired look. One of these 
parameters is the distance a label is placed above or below the line it labels.  Figure 2 shows a clip of the Annotate Defaults dialog box in Carlson Survey 2011.

The text height is specified using the “Text Size Scaler” value, and the distance that text is offset from the line it labels is specified by the “Text Offset Scaler.” Both of these values are “plotted” distances in inches. You can also see the horizontal scale setting for the drawing. Once plotted, text placed using these settings will be 0.08” high, and it will be positioned 0.04” off the line. A good rule of thumb is to set the offset value at one half the text height.

Another example of an annotation standard that can be associated with a plotted distance is how far apart to place elevation labels along a contour. Rather than specifying that contour labels are “300’ apart in a 50-scale drawing” or “600’ in a 100-scale drawing,” your standard should state that: On the plotted sheet, contour labels shall be shown at 6” intervals along each index contour.

I hope this information has provided a good kick-start toward your CAD standardization goals and helps get you thinking in plot sizes rather than drawing sizes. As noted above, future columns will focus on other supposed standardization nightmares such as dimension styles and will also touch on some specifics of the different CAD programs. Please don’t hesitate to contact me if you have questions. I hope your summer is off to a great start!

This article originally appeared in the June 2011 issue of Professional Surveyor magazine.

1 of 1